
One of the key challenges in building decarbonization is not just identifying what interventions to implement, but determining when to implement them. Retrofit decisions rarely happen all at once; they are shaped by tenant lease lengths and turnover, capital planning cycles, equipment lifespans, and regulatory timelines. The Decarbonization Over Time feature in Carbon Signal allows you to create realistic, phased implementation plans that reflect these real-world constraints.
Decarbonization Over Time takes the results of the baseline building and applies selected interventions across a multi-year timeline. The result is a dynamic emissions reduction forecast that can be used for capital budgeting, investment planning, and communicating long-term decarbonization goals. Rather than a single static intervention package, this feature supports iterative planning.
Creating a Reduction Pathway
By default, each intervention is scheduled for implementation one year after the baseline data year.
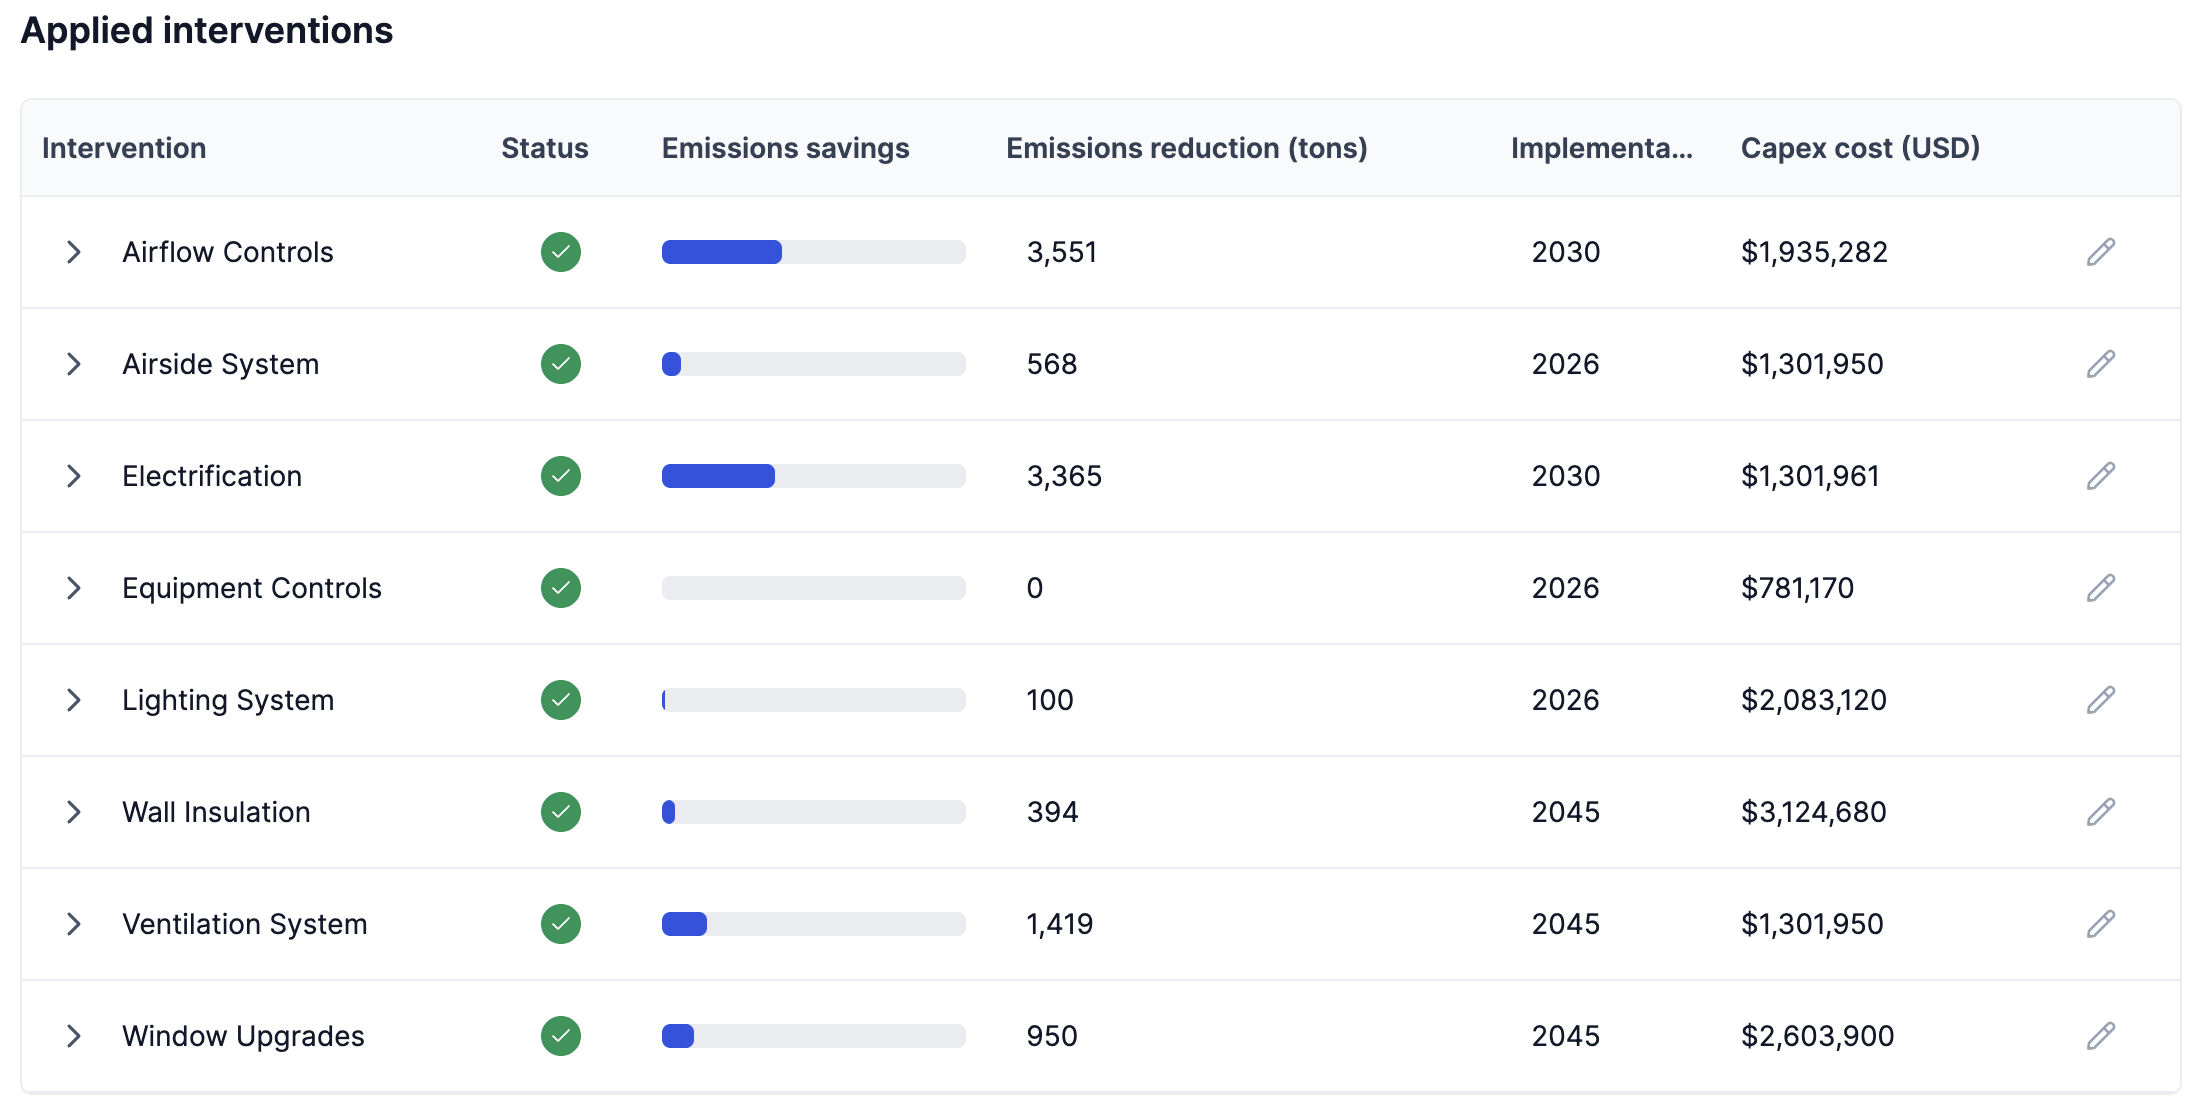
To modify when an intervention is implemented, navigate to the Applied Interventions table listing each intervention along with its estimated emissions reduction, implementation year, and capex cost. Click the Edit icon next to the intervention you want to update.
A pop-up will appear where you can change the Implementation Year—this must be a year between 2020 and 2050.
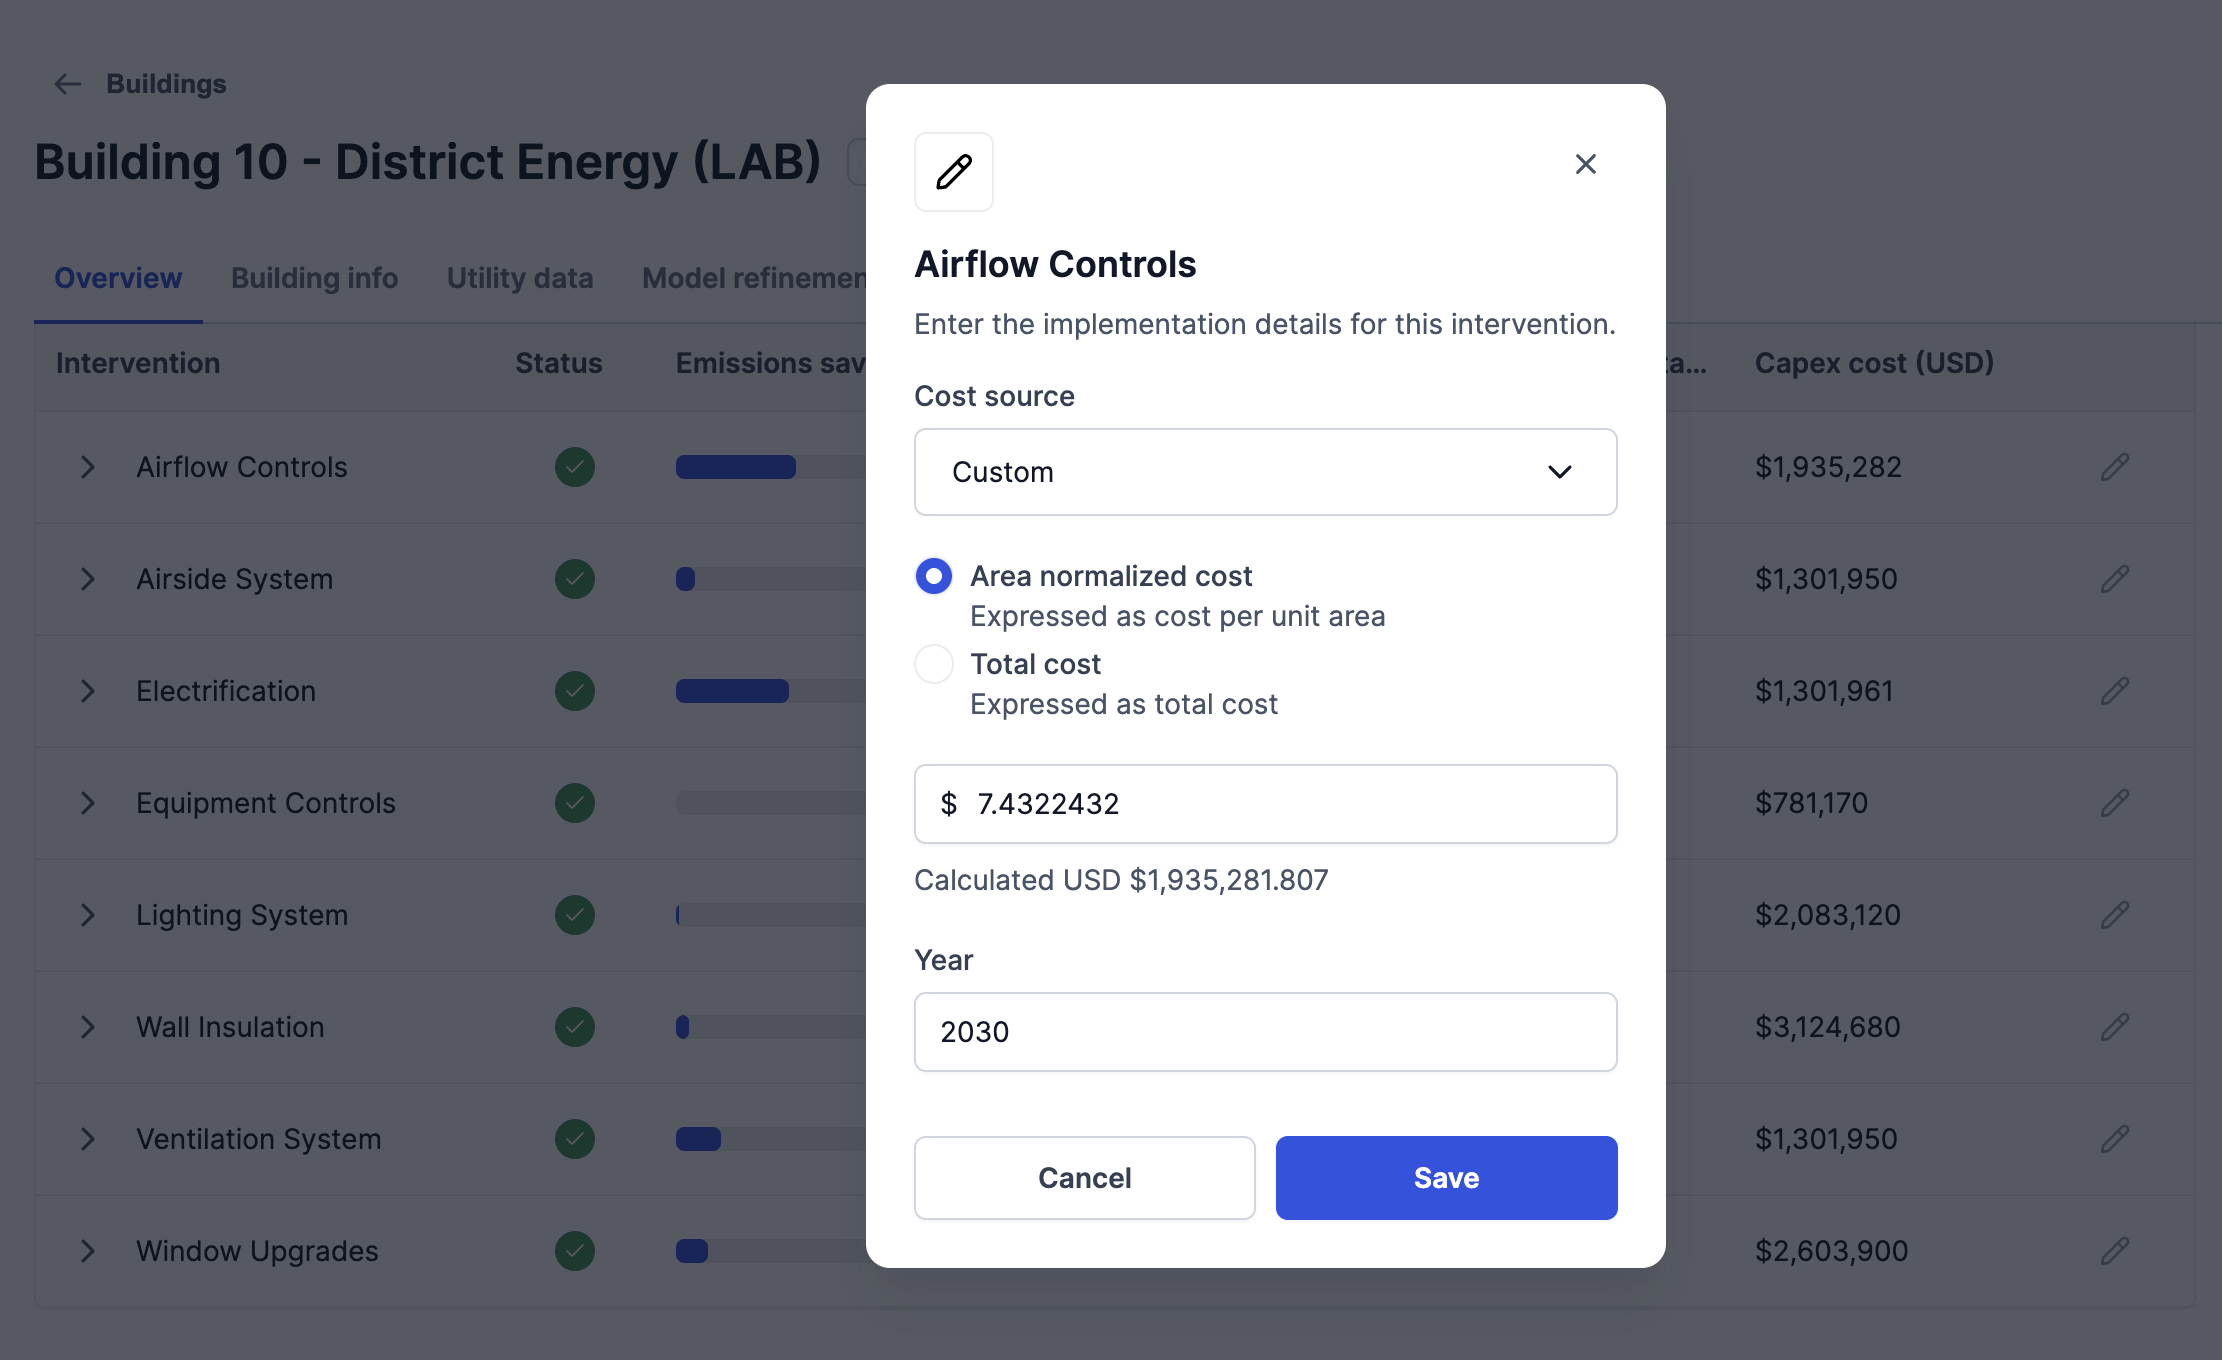
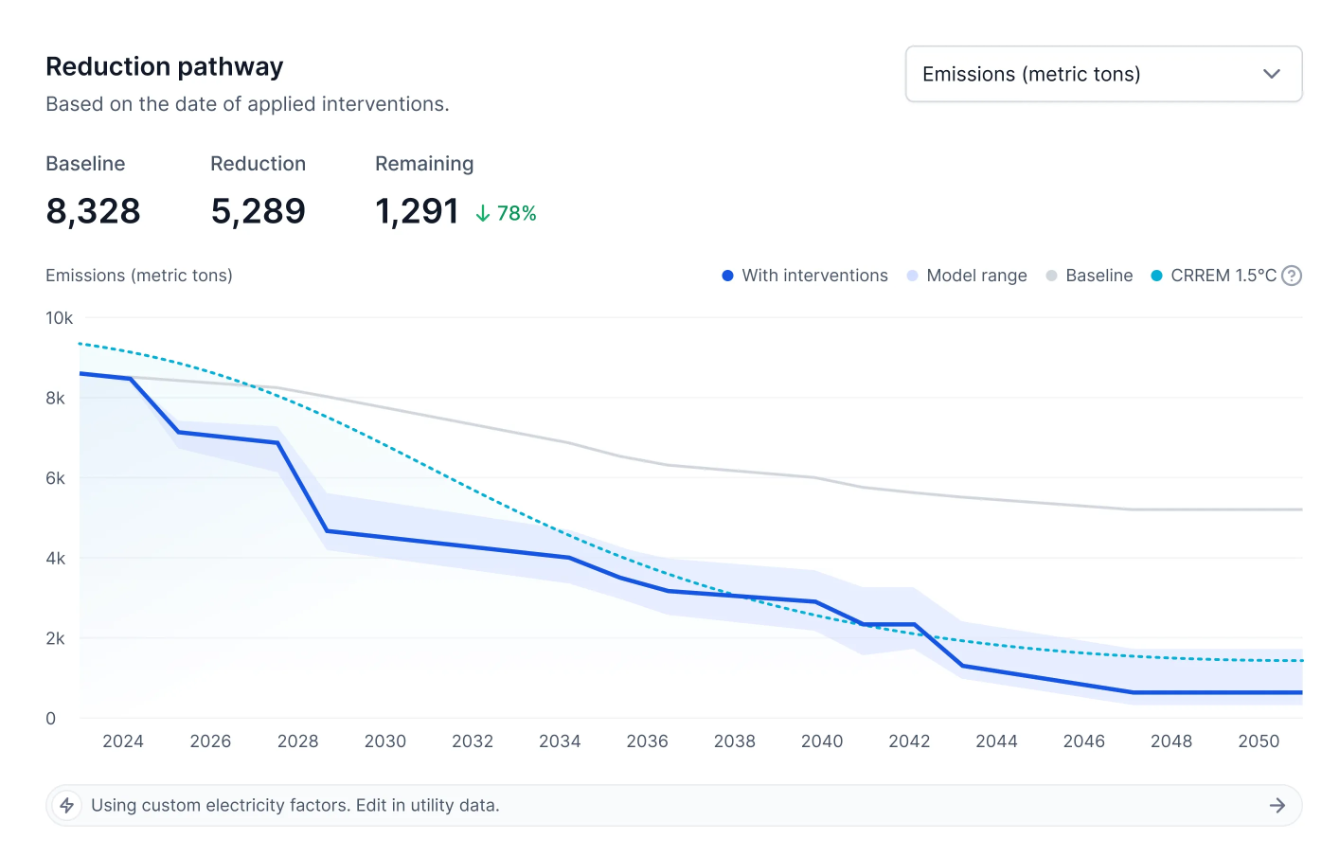
After making your selection, click Save. The Reduction Pathway chart will then refresh automatically to reflect the change, showing the updated carbon reduction occurring in the selected year. This allows you to quickly adjust your timeline and see how different intervention schedules affect your overall emissions trajectory.
Using Time-Based Emission Factors
The Time-Based Emission Factors feature can be enabled to reflect how energy-related emissions are expected to change over time. A good example of this is that electricity grid emissions are expected to decrease over time as the mix of energy sources on the grid becomes cleaner. This allows you to understand how your building’s carbon emissions change with evolving grid carbon intensity, even if energy use remains constant.
To access this feature, go to the Building Details page and click the Utility Data tab.
By default, Carbon Signal uses emissions factors from Our World in Data (OWID). The most recent available year in the OWID dataset is applied and held constant from that year through 2050.
To review or update emissions factors:
- Click Edit on the Utility Data page.
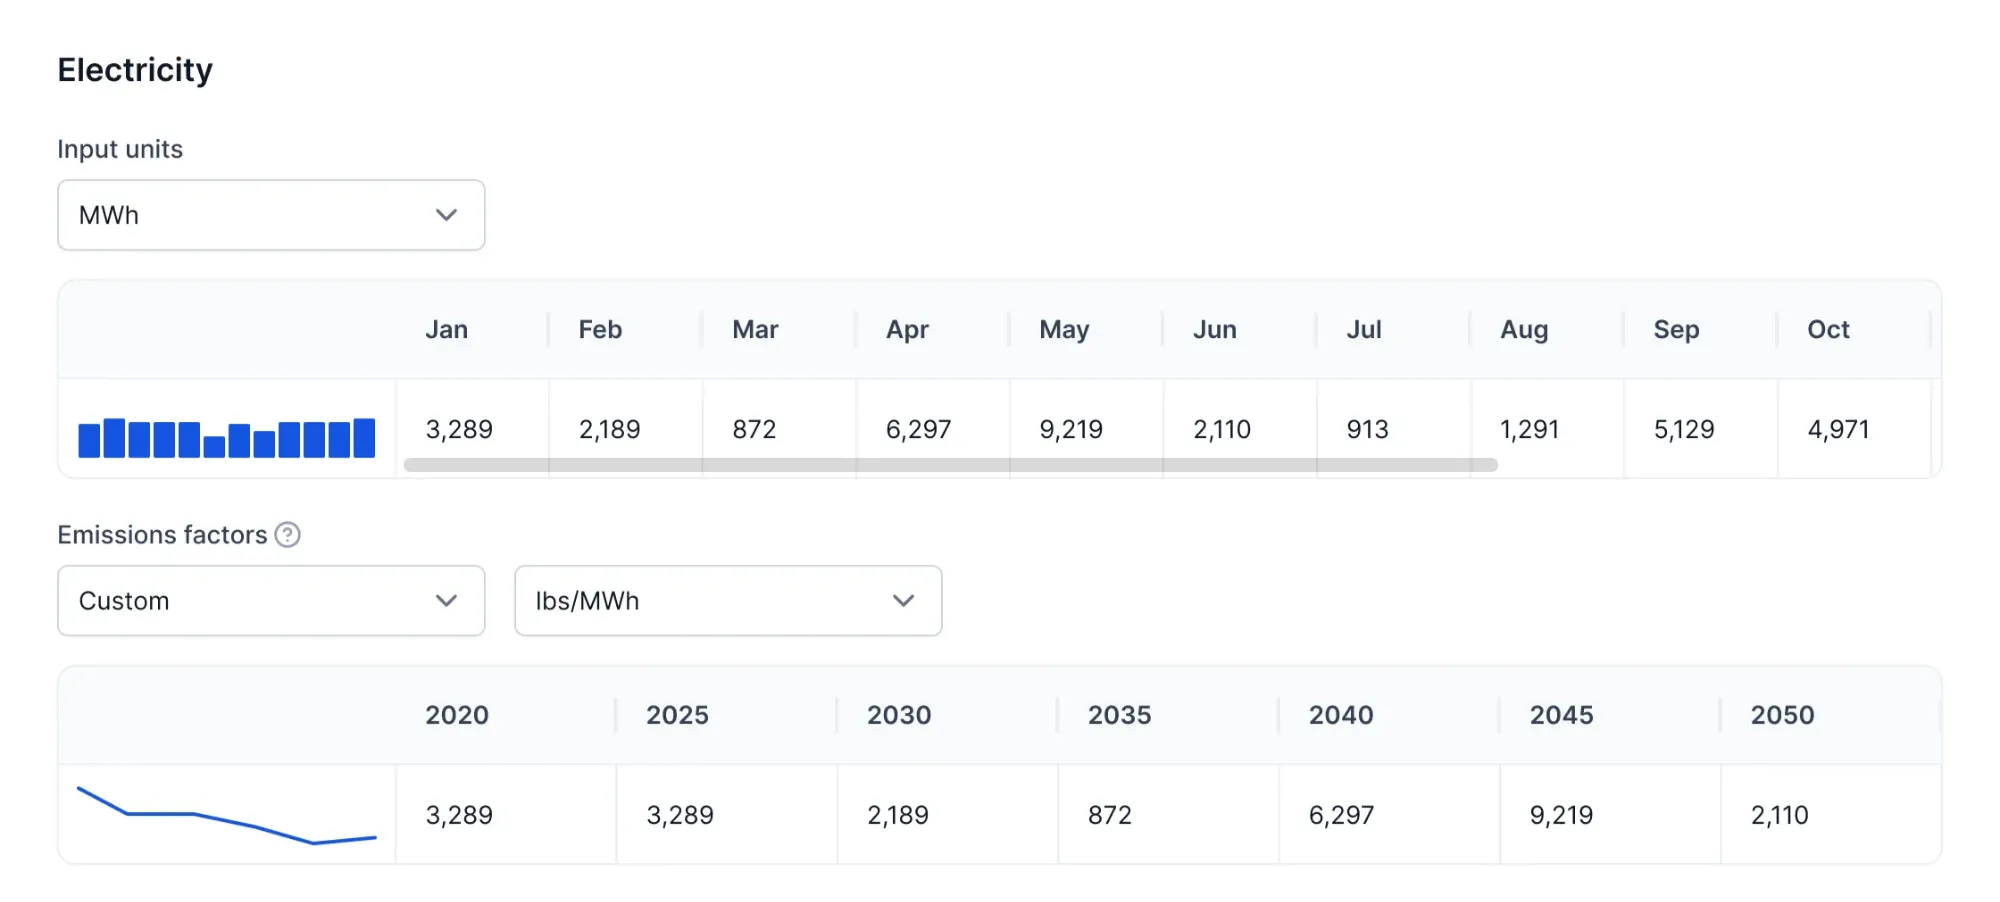
- You will see emissions factors listed for each utility type: Electricity, Natural Gas, District Heating, and District Cooling.
- For each utility, click the dropdown menu to choose a different emissions factor source. Available sources include:
- OWID (Our World in Data)
- CRREM (Carbon Risk Real Estate Monitor)
- NREL Cambium (from the U.S. National Renewable Energy Laboratory)
You can also set custom emissions factors by clicking on the value you’d like to edit for a specific year. Custom values can be entered in 5-year increments between 2020 and 2050. You are not required to enter values for every 5-year interval. If you enter a value for only some years, the platform will interpolate the emissions factors for the years in between.
This flexibility allows you to tailor emissions trajectories based on your own assumptions or internal forecasts.
CRREM Science-Based Targets
The Carbon Risk Real Estate Monitor (CRREM) provides science-based decarbonization targets for real estate, aligned with the goals of the Paris Agreement. These targets help assess whether a building’s projected emissions are on track with a 1.5°C carbon reduction pathway.
The Decarbonization Timeline on the Building Details page now includes a CRREM 1.5°C Science-Based Target (SBT). This provides a reference line to benchmark your building’s carbon performance against internationally recognized decarbonization pathways.
The CRREM 1.5°C is automatically selected based on the building’s type and location.
If a CRREM 1.5°C science-based target does not appear for your building, this means CRREM does not currently provide a target for that specific location and building type combination. Carbon Signal will automatically omit the CRREM target line in these cases.
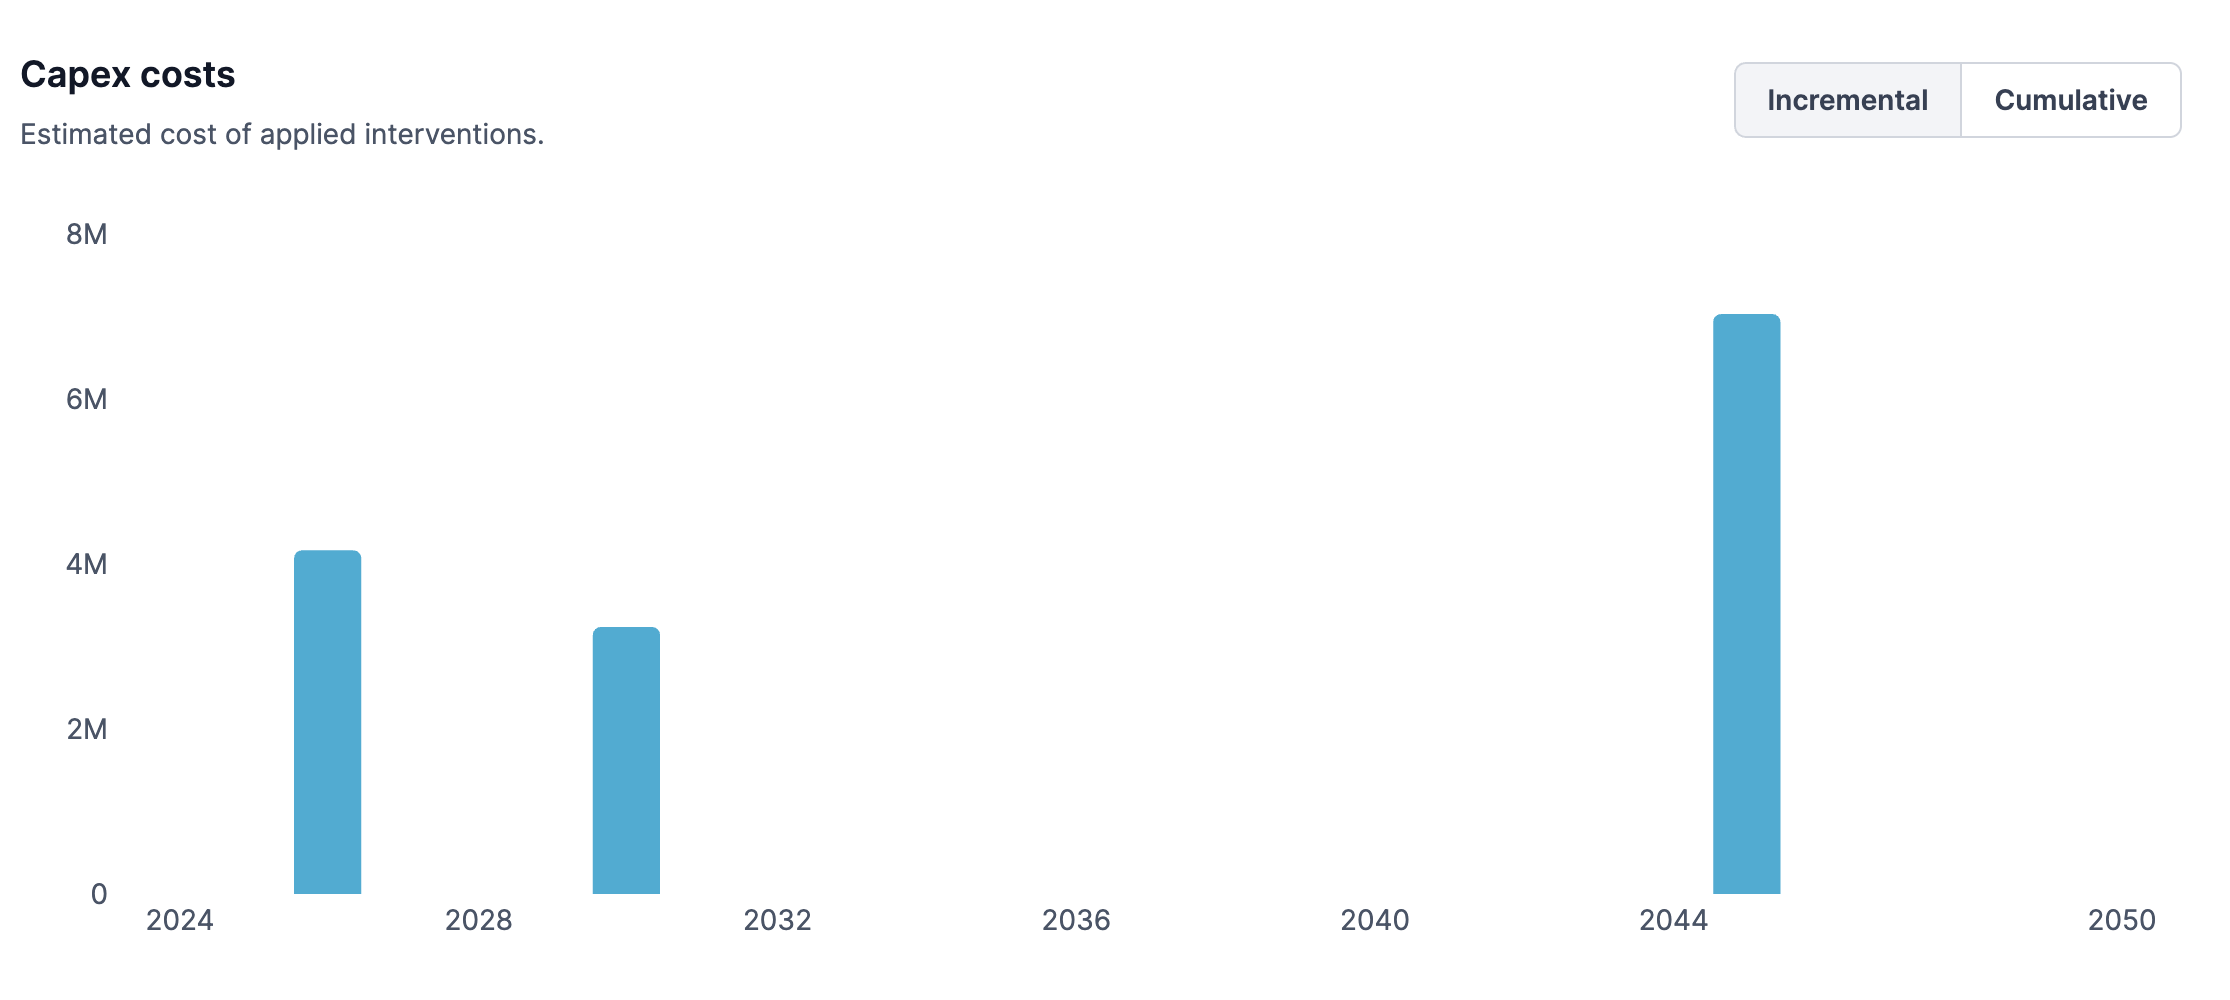
Capital Expenditures (CapEx) Planning
In addition to tracking emissions reductions, the Decarbonization Over Time feature is designed to support capital planning by visualizing the estimated capital expenditures (CapEx) of interventions over time. A bar chart below the Applied Interventions table displays the CapEx costs for each intervention, organized by their specified year of implementation. This helps users align retrofit planning with annual budget cycles and investment timelines.
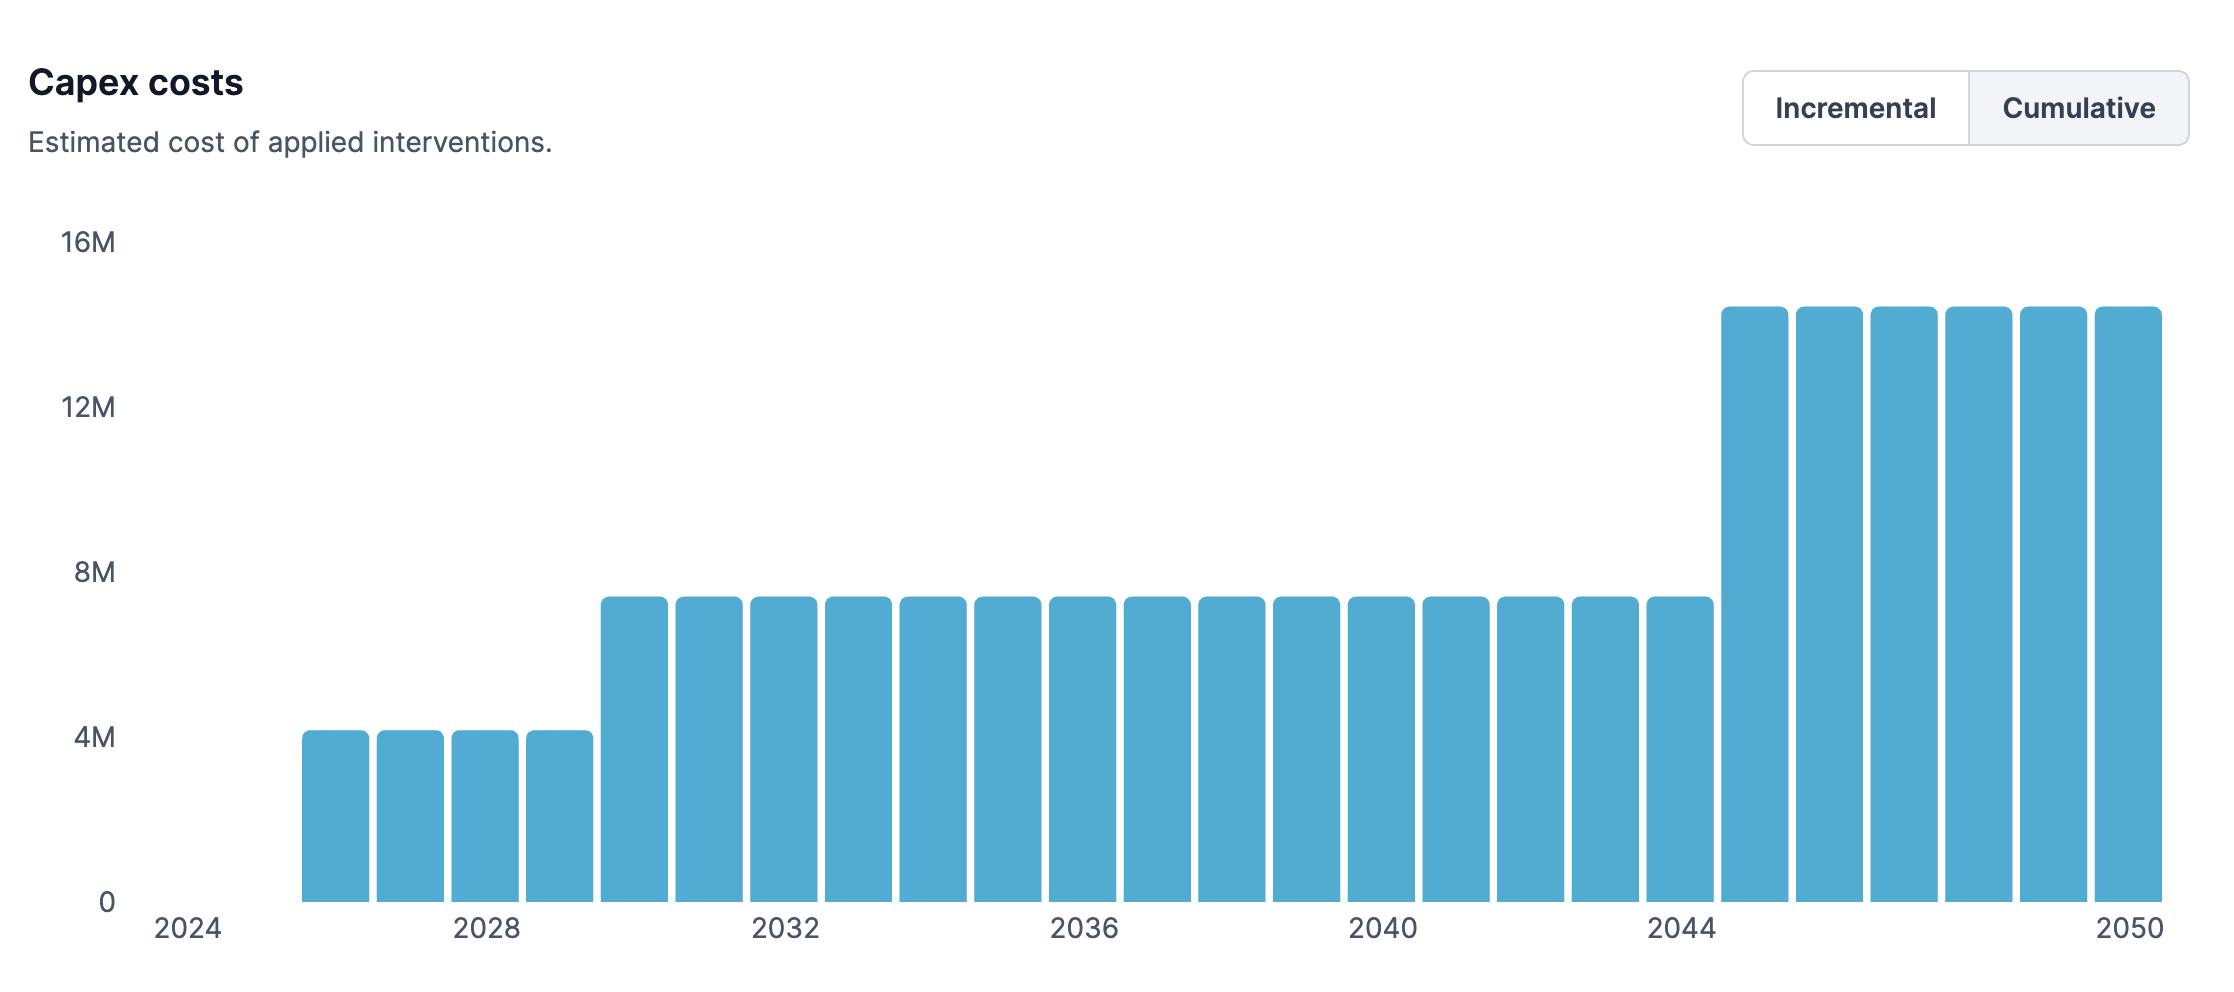
The chart can also be toggled to show cumulative capital costs year over year, providing a clear view of total spending over the planning horizon.
Understanding the Interaction Between Building Interventions
It’s easy to assume that if one intervention saves energy, and another does too, you can just add the two together. But buildings don’t work that way. When you make one change—like improving insulation—it can affect how much of a difference another change—like replacing the heating system—will make. Since better insulation means the building needs less heat, the new heating system won’t save as much as it would have on its own. These overlapping effects mean that doing multiple upgrades doesn’t always equal the total of their individual savings.
Carbon Signal takes this into account in the Decarbonization Over Time tool. It applies each intervention one after the other and updates the impact along the way. That way, the savings shown are more accurate and avoid counting the same benefits twice.