
Carbon Signal is designed to quickly create high-fidelity energy models based on a minimal set of input data. By utilizing advanced techniques for model creation, calibration, and simulation, Carbon Signal accelerates decarbonization analysis by translating data into actionable insights.
Methodology
Building owners have traditionally approached decarbonization analysis through a costly and time-consuming process: hiring specialized consultants to gather data and develop detailed “bottom-up” energy models. While this approach can deliver valuable insights when done properly, it can be prohibitively expensive, time-consuming, and present implementation challenges that become unmanageable across large portfolios. Carbon Signal eliminates these pain points by delivering consultant-quality analysis at a fraction of the time and cost, enabling portfolio-wide decarbonization strategies that were previously impossible to scale.
Carbon Signal works by rapidly identifying the specific set of performance characteristics - insulation values, system efficiencies, occupancy levels - that can explain observed patterns of energy use. Once identified, the platform automatically builds an energy model and uses the model to test various interventions, such as envelope upgrades, lighting retrofits, and system improvements. The use of physics-based energy models (Carbon Signal uses EnergyPlus, a U.S. Department of Energy backed analysis engine) is a critical component of the platform as it allows for a high level of insight into building operations and a high degree of flexibility when modeling interventions. The platform can evaluate any type of intervention, regardless of complexity, in any type of building, anywhere in the world.
In addition, Carbon Signal uses ensemble modeling - creating multiple energy models that collectively represent a single building - to provide quantifiable uncertainty ranges for all of our projections. If the user only provides a few data points for the building, Carbon Signal can still provide immediate feedback, though it will have wider confidence intervals. As you incorporate additional details, these ranges shrink, delivering increasingly precise results. This dynamic approach lets you start with basic information to gain quick insights, then strategically refine only the areas where greater precision adds value, eliminating the all-or-nothing data burden of traditional methods while maintaining complete transparency about confidence levels throughout your decision-making process.
Adding Building Data
The easiest way to get started with Carbon Signal is to use the Carbon Signal Input Data Spreadsheet, which is accessible by clicking Upload Data from the main Buildings page. Clicking on Upload Data will open a modal where you can download the latest version of the spreadsheet and then upload the file after filling it out.
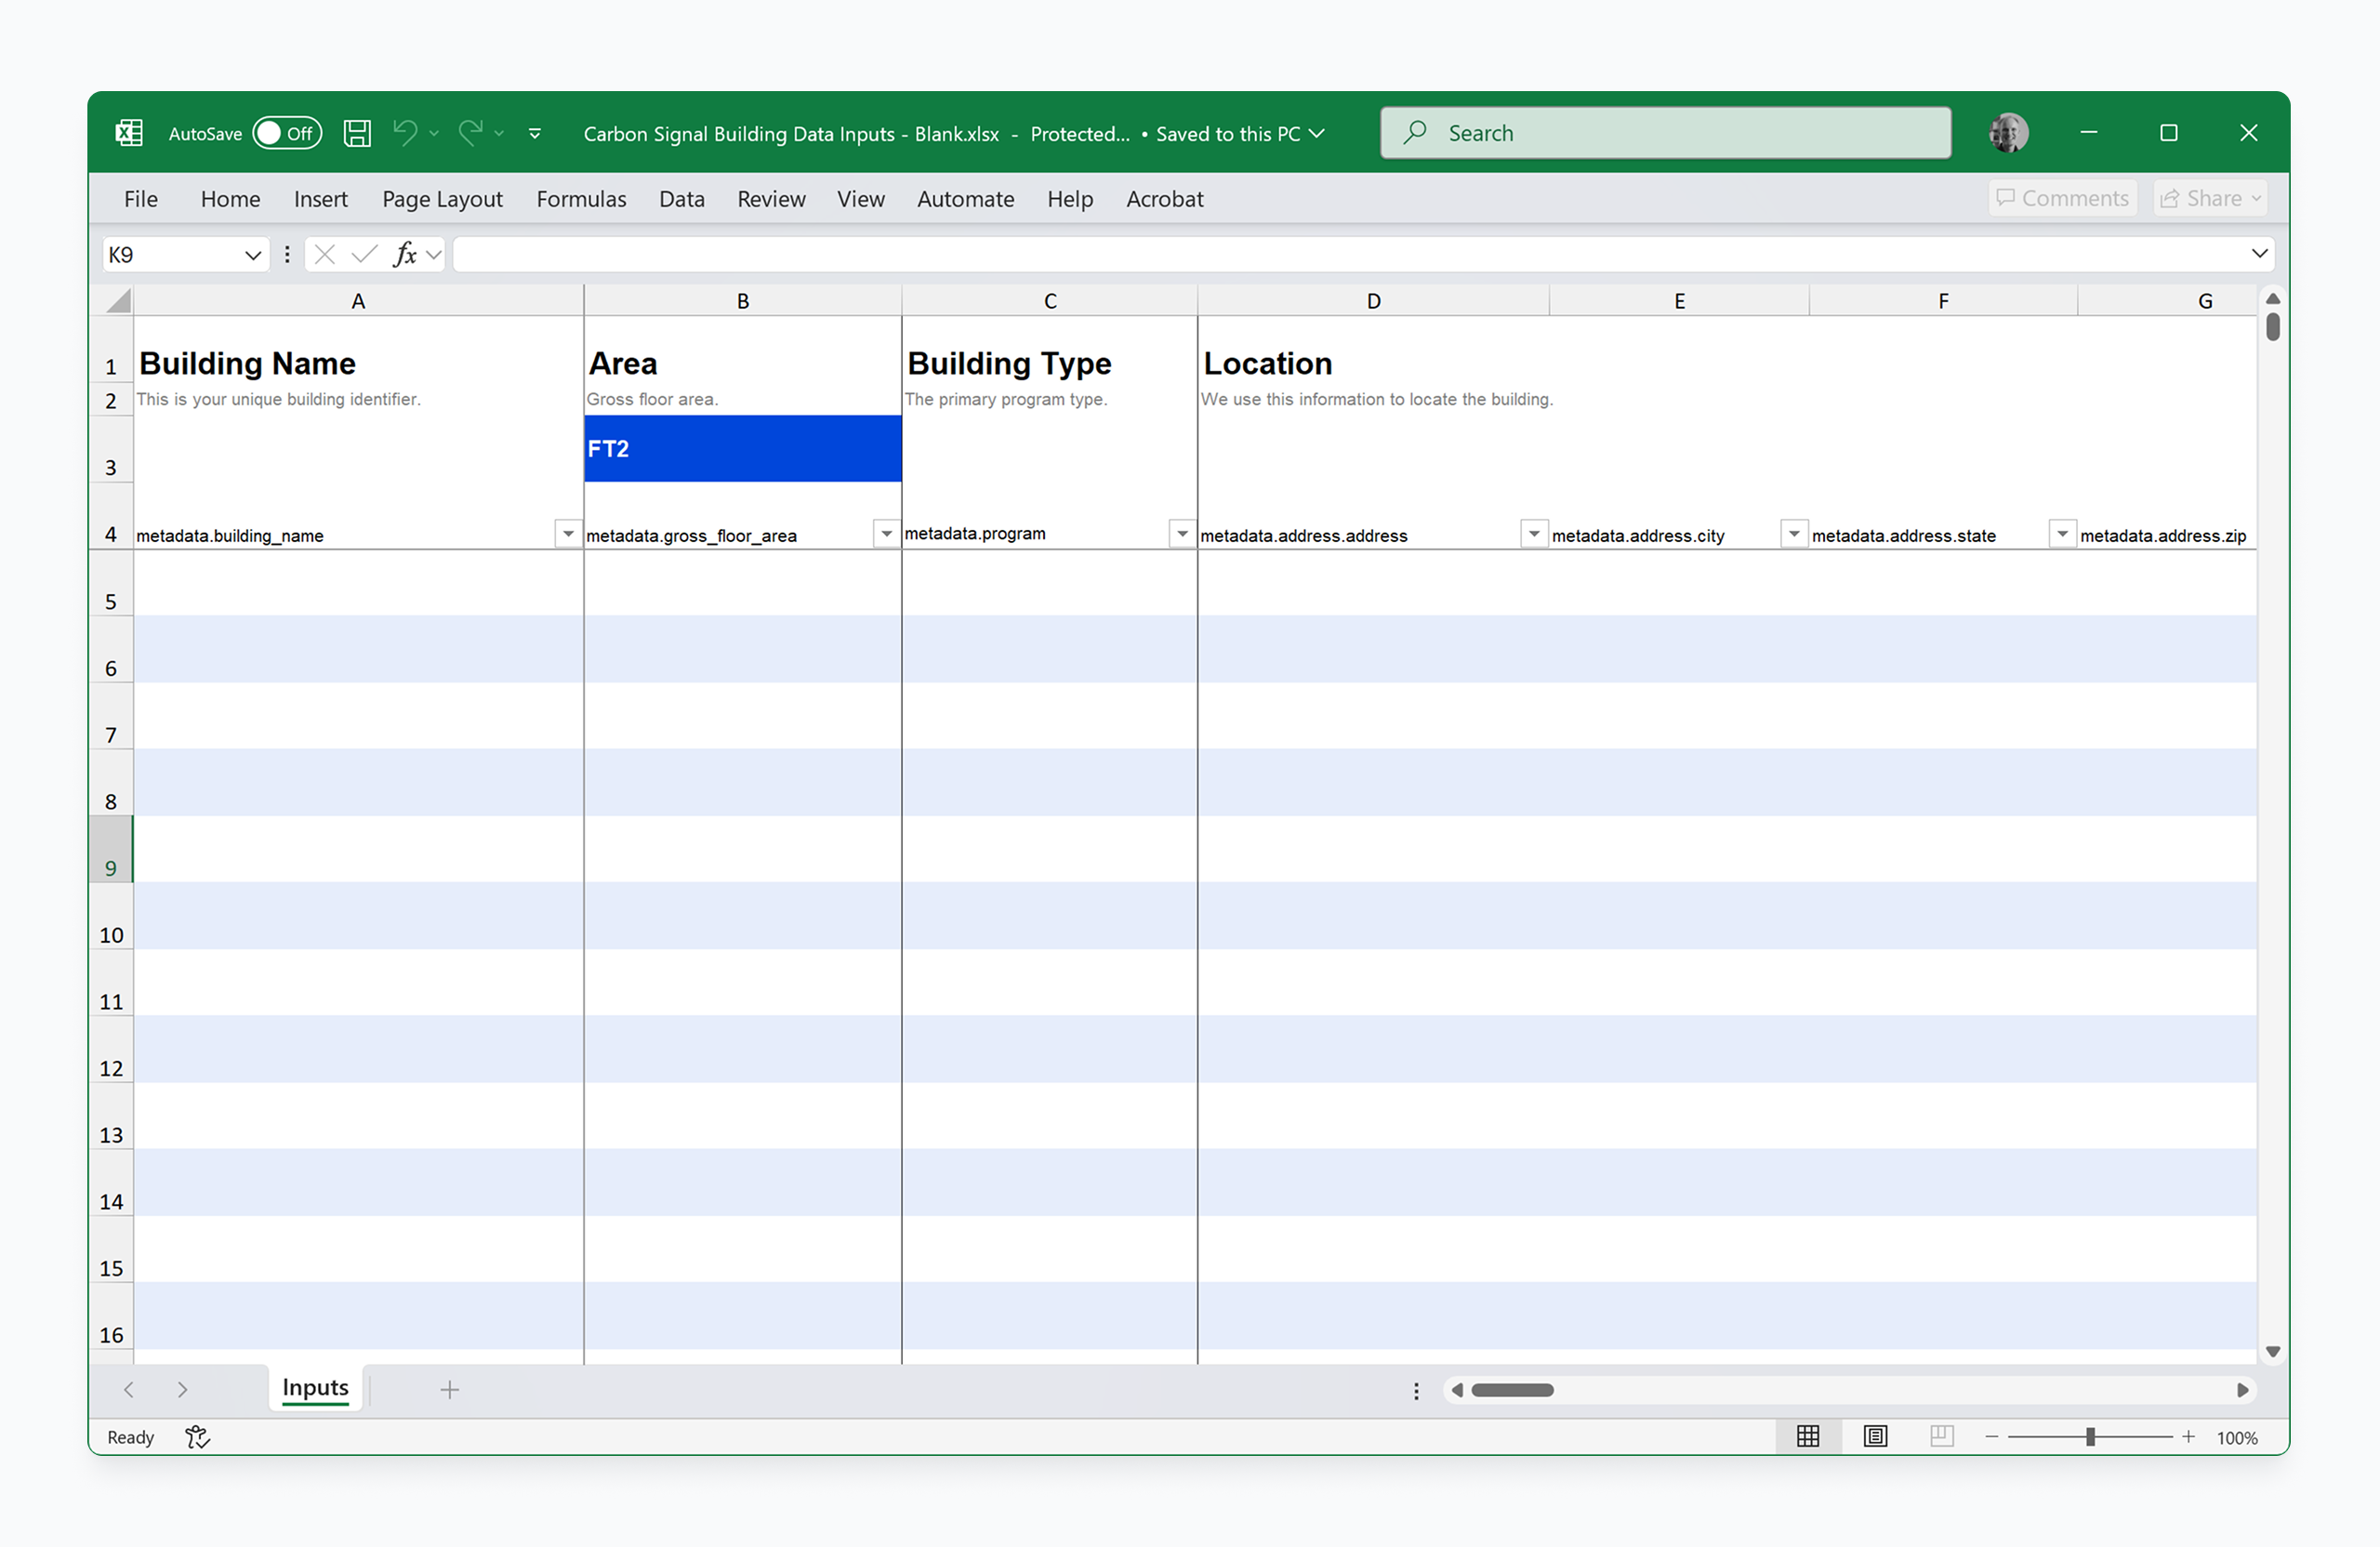
The spreadsheet has several required fields: Building Name, Area, Location (address or geocoordinates), and at least one month of energy use data for one utility. After you fill out and upload the spreadsheet, Carbon Signal will automatically start creating energy models to match the data. Depending on the size of the portfolio, this process could take anywhere from 1-10 minutes.
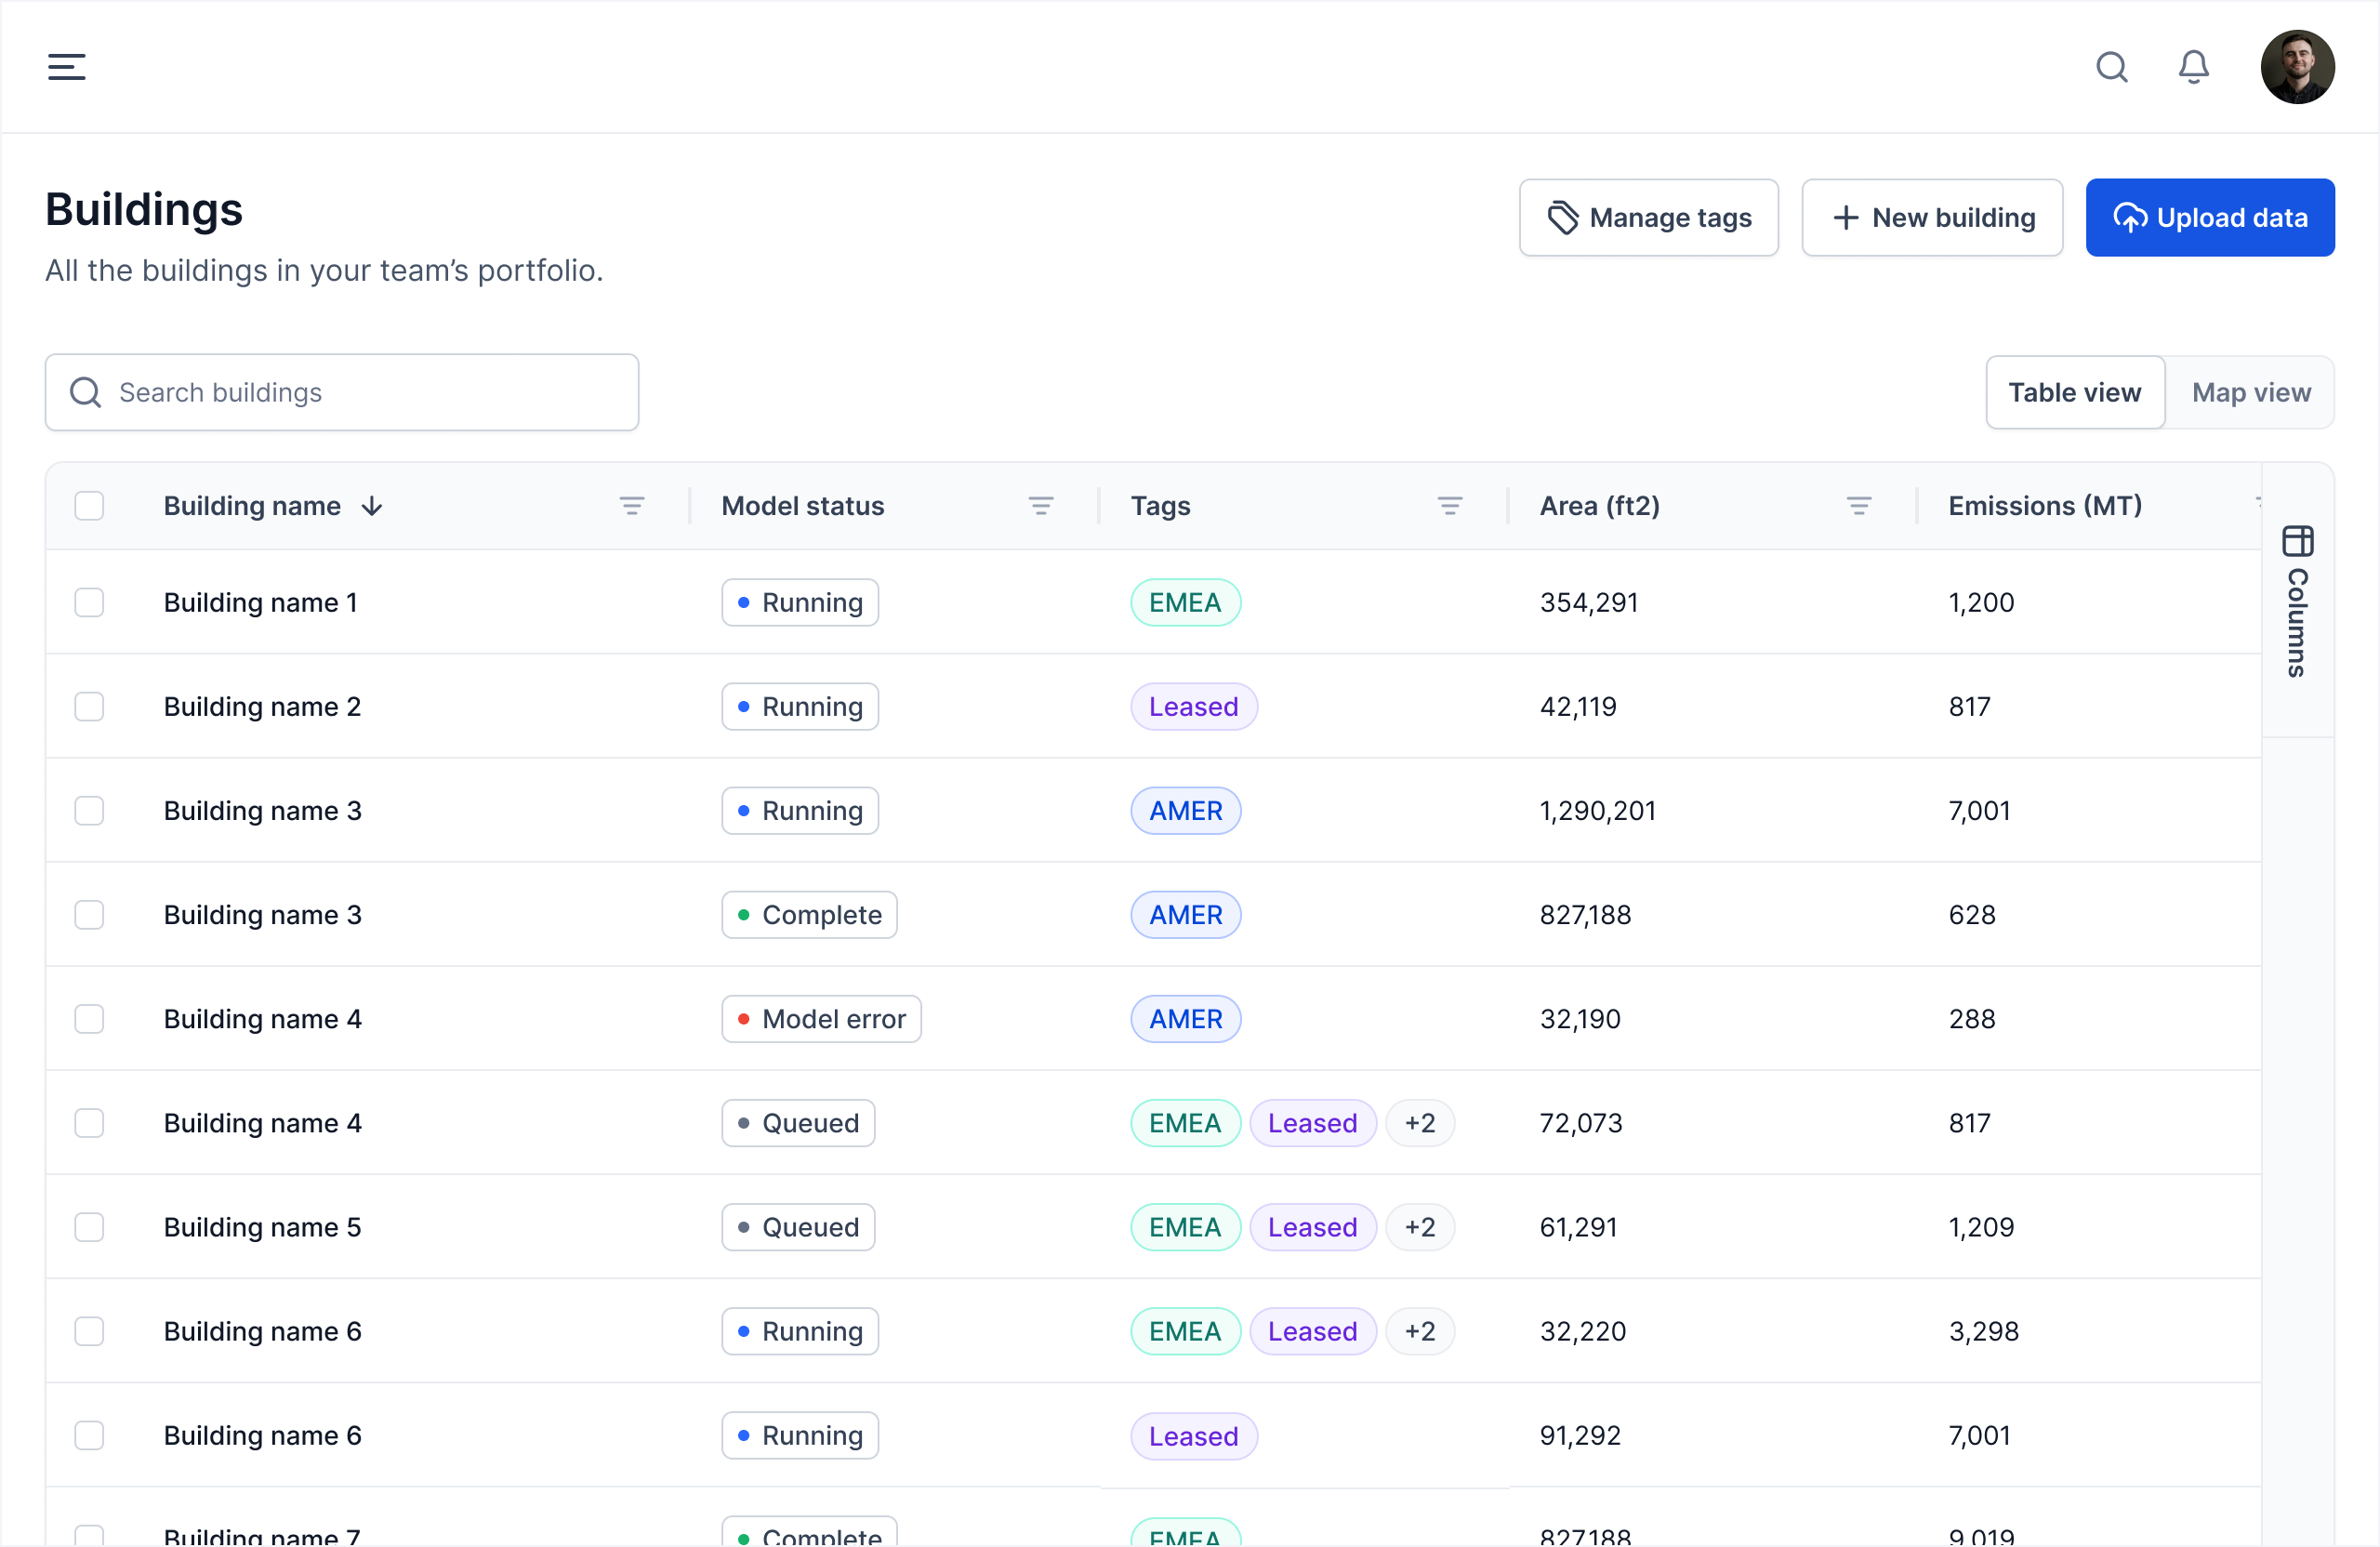
After the models have finished running, their model status will change to Complete. You can view the full details of a model by clicking on a building in the data table on the main Buildings page. For more information on uploading building data, see Uploading Data.
When you upload information to Carbon Signal, it automatically triggers two separate but related events: calibration and simulation. During the calibration process, we use machine learning to identify the performance characteristics of your building. During the simulation step, we use EnergyPlus to model how your building uses energy throughout the year. Combined, these steps can take 1-10 minutes, depending on the number of buildings in the portfolio.
Viewing Results
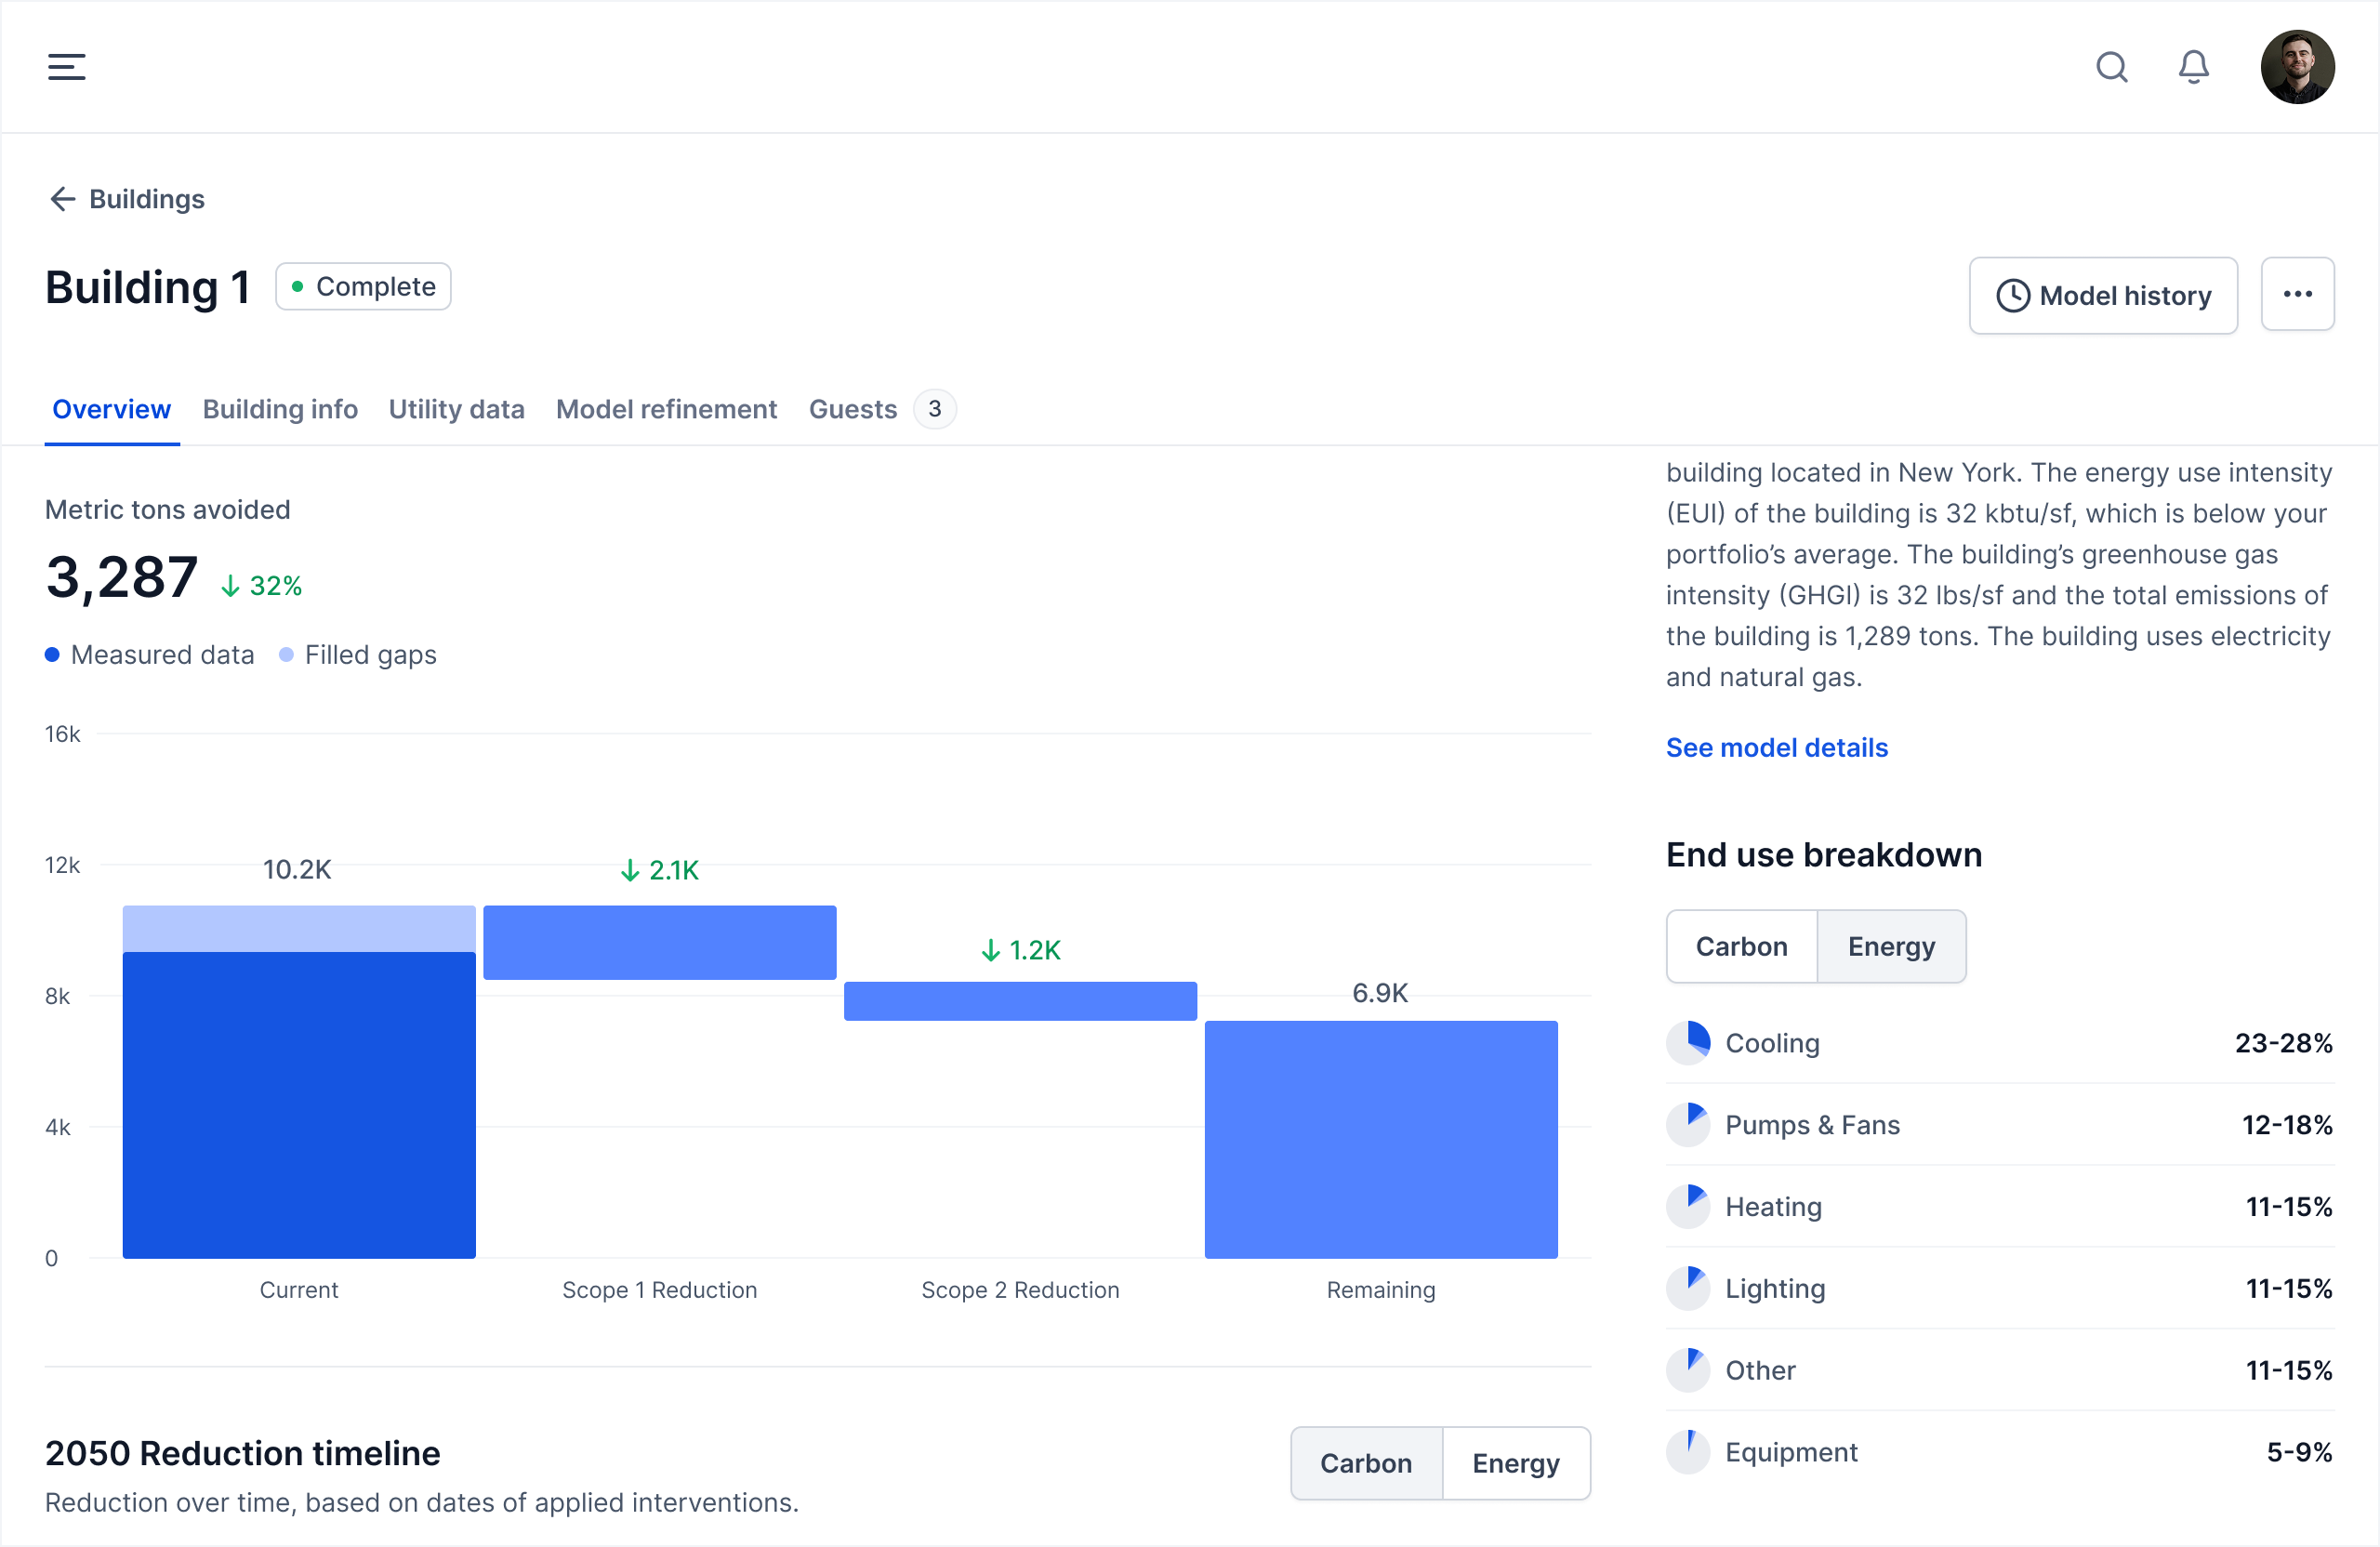
After the models are finished running, you’ll be able to see the model details by clicking on a building in the Buildings data table.
This opens a detailed page for the building, where you can view information about end-uses (heating, cooling, lighting, etc.) and the results of the intervention analysis. You’ll also be able to see details about how closely the model is calibrated to the measured utility data, shown on the Utility data tab, and make adjustments to the model on the Model refinement tab
For more information on the analysis methodology and how to interpret model data, check out our resources page on carbonsignal.com.