
Financial Modeling
Financial modeling is a core component of evaluating and prioritizing decarbonization investments. While energy and emissions impacts are critical, decision-making often depends on understanding how interventions perform financially over time. This includes not only how quickly an investment pays back, but also how it performs relative to other variables over time, such as replacement and maintenance costs, utility rate changes, and penalties related to building energy performance standards
The Financial Modeling features in Carbon Signal enable users to evaluate the financial performance of decarbonization interventions directly within the platform. By connecting modeled energy savings, emissions reductions, and cost assumptions, Carbon Signal allows users to assess individual interventions and combined packages using standard financial metrics.
Viewing Financial Modeling Analysis
Financial modeling results can be viewed at the intervention level and the building level from the Building Details page, and across the portfolio from Portfolio Overview.
Viewing Results at the Intervention Level
For each intervention, Net Present Value and Marginal Abatement Cost can be viewed over different analysis horizons. Users can see these metrics in a 3-year, 10-year, or 15-year timeframe to understand how the financial performance of an intervention changes over time.
Viewing Results at the Building Level
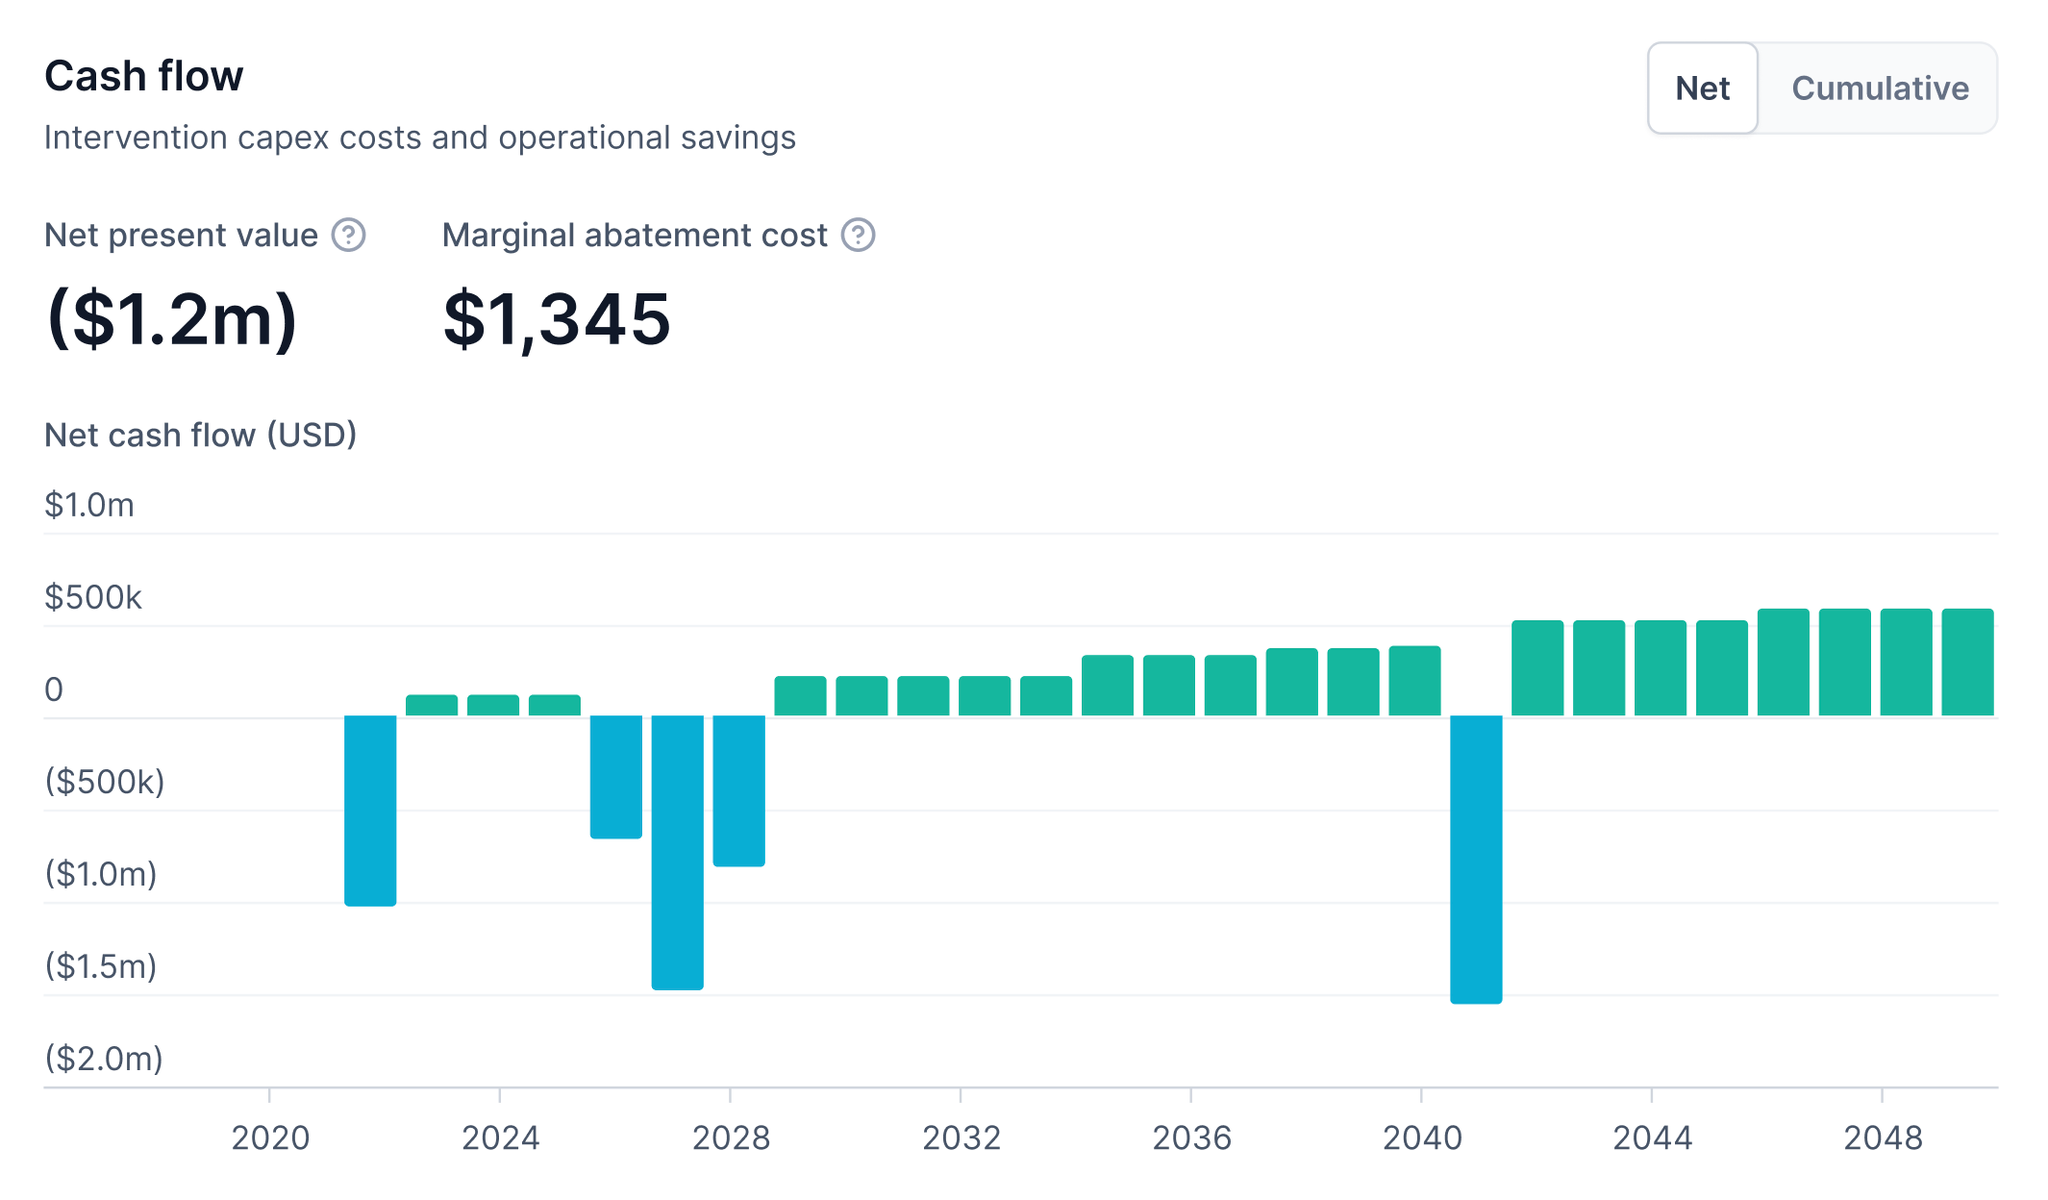
Navigate to the Building Details page for a building. When one or more interventions are applied, Carbon Signal displays a life cycle cost analysis chart showing projected cash flows over time for the building. The overall Net Present Value and Marginal Abatement Cost for the combined set of applied measures are also shown, allowing users to evaluate bundled interventions as a single investment decision.
Viewing Results Across the Portfolio
The Portfolio cash flow widget on Portfolio Overview combines the cash flows of every building in the current view, with the net present value and marginal abatement cost for that set. Like the other widgets, it respects whatever filter is applied to the page, so you can look at the financial picture for a region, a building type, or any other segment.
Adjusting Financial Modeling Inputs
Financial modeling inputs can be adjusted at both the intervention level and the building level. These inputs directly affect calculated financial metrics.
Adjusting Inputs at the Intervention Level
- Navigate to the Building Details page for a building.
- Select the intervention you would like to adjust.
- In the intervention slide panel, adjust the relevant financial inputs, including:
- Capital cost of the intervention
- Any first year utility incentives
- Service life, in years, which determines when the intervention is replaced. The capital cost recurs at every multiple of the service life within the analysis horizon, so a 15-year measure in a 30-year analysis is paid for twice. The input accepts 1 to 50 years.
- Changes in annual maintenance costs, including increases or decreases and the associated dollar amount per year
These inputs are used to calculate intervention-level cash flows and financial metrics.
Adjusting Utility Rates
Utility rates drive the operational savings side of every calculation. On the Building Details page, the utility costs table holds the price and the annual escalation rate for each utility. These are resolved from the building’s location by default, and can be overridden per building. The same values can be set for many buildings at once from the Buildings page using More actions then Edit utility costs.
Adjusting Inputs at the Building Level
- From the Building Details page, navigate to the Building Info tab.
- Adjust the cash flow discount rate used for Net Present Value calculations.
- Set the Hold period end year, which is how long you expect to hold the building. It can be any year from 2020 to 2050 and defaults to 2050. Ticking Constrain analysis to hold period cuts the financial analysis off at that year, so interventions are only credited with the savings they deliver while you still own the building.
Building-level inputs are applied consistently across all interventions and influence the overall financial metrics shown for the building.
Whether avoided Building Performance Standards penalties count toward the financial analysis is set per standard, not once for the building. On the building’s Overview tab, each performance standard card carries a selector offering Default, which automatically picks the pathway with the lowest penalties if you take no action, any specific pathway you want to model against, or Exclude standard, which keeps that standard and its penalties out of the building’s analysis entirely.